


Why is my Mac so slow? How to find what's actually eating your CPU and memory
Spinning fans, a beach ball, a battery that drains by lunch. Here is how to find the real culprit in a few minutes — and the usual suspects, explained.
4 min read

Your Mac was fast last month. Now the fans are spinning, apps take a beat to respond and the beach ball keeps showing up. Before you reinstall macOS or start shopping for a new machine, spend five minutes finding out what is slowing it down. Nine times out of ten, it is one specific thing.
Step 1: open Activity Monitor the right way
Press ⌘ Space, type Activity Monitor and press Return. Then:
- Click the CPU tab and sort by % CPU (click the column header).
- Choose View → All Processes so nothing is hidden.
- Watch for ten seconds. You are looking for anything that stays near the top, not a single spike.
How to read the numbers: % CPU is measured per core. A process at 100% is using one whole core; 400% means four. On a Mac with eight or more cores, a single process at 100% is rarely the reason everything feels slow — several things at 50–100% at once usually are.
Step 2: check memory pressure, not "memory used"
Switch to the Memory tab and look at the Memory Pressure graph at the bottom — not the "Memory Used" number. macOS deliberately fills spare memory with cache, so a high "used" figure is normal.
| Memory pressure | What it means |
|---|---|
| Green | Plenty of memory. Your slowdown is something else. |
| Yellow | macOS is compressing memory to make room. Things may hitch. |
| Red | Memory is exhausted and the Mac is swapping to disk. This is your slowdown. |
Also check Swap Used. A few hundred megabytes is fine; many gigabytes means you are routinely running out.
Step 3: know the usual suspects
| Process | What it is | What to do |
|---|---|---|
| Google Chrome Helper (Renderer), Safari Web Content | One process per tab or extension | Close heavy tabs, especially video and dashboards; audit extensions |
| kernel_task | macOS cooling the machine by keeping the CPU busy | Your Mac is hot: check vents, what is charging, and anything else using CPU |
| WindowServer | Draws everything on every display | Several high-resolution displays, transparency and animations all add up |
| mds_stores, mdworker | Spotlight indexing | Normal after an update or copying lots of files; it settles down |
| photoanalysisd | Photos analysing your library | Normal after importing; lets up when it finishes |
| backupd | Time Machine backing up | Let it finish, or schedule backups for later |
| node, python, java | Dev servers, scripts, language tools | Find which project they belong to and stop the ones you forgot |
| com.apple.Virtualization.VirtualMachine | Docker Desktop and other VMs | Stop containers you are not using; lower the VM's memory limit |
Step 4: check the disk
A nearly full disk slows everything down, because macOS needs free space for swap, caches and updates. If you are below 10–15% free, that alone can explain a sluggish Mac. We wrote a separate guide on where your disk space actually went.
Why Activity Monitor only gets you halfway
Activity Monitor is a fine tool with two big blind spots:
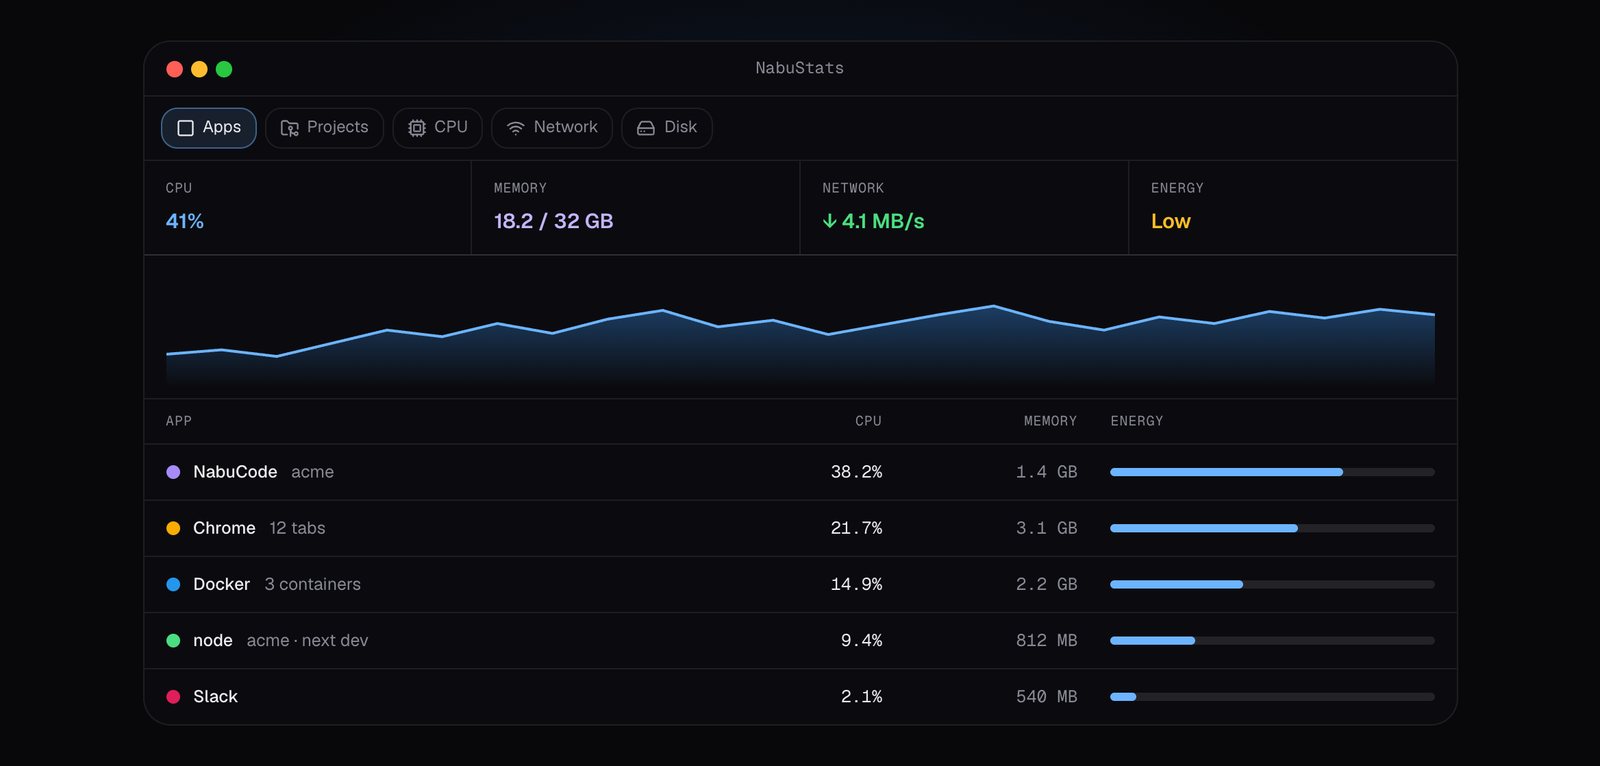
It shows processes, not apps. Chrome is not one row — it is forty helpers, each using a little. A dev setup shows up as a dozen anonymous node processes with no hint of which project they belong to. Adding it up is left to you.
It has no history. The spike that froze your Mac ten minutes ago is gone by the time you open the window. You are left looking at a calm list, guessing.
A monitor that thinks in apps and projects
That is the gap NabuStats fills. It is an activity monitor for your menu bar that groups the numbers the way you think about them:
- Apps, not processes. Chrome's forty helpers add up to one Chrome. Every row is something you recognise and can quit.
- By project. Dev servers, test runners and coding agents roll up under the project folder they are running in.
- Containers too. Docker containers appear beside your apps, with their own CPU and memory.
- History you can scrub. Go back to the spike that froze your machine and see exactly what caused it.
- Everywhere you work. A live readout in the macOS menu bar, a tray popup and mini widget on Windows and Linux, and a terminal mode for SSH sessions.
Quick fixes that usually work
- Quit what you are not using — properly, with ⌘Q, not just closing the window.
- Restart once a week. It clears leaked memory and finishes pending updates.
- Trim login items in System Settings → General → Login Items & Extensions.
- Close browser tabs you are "saving for later". Bookmark them instead.
- Stop forgotten dev servers and containers. They are the most common hidden load on a developer's Mac.
- Keep 15% of your disk free.
A slow Mac almost always has a specific cause. Measure first, then fix that one thing — it is faster than any cleanup ritual, and you will know when it comes back.